
[vc_row][vc_column][vc_column_text]
SLOCAT Quick Wins on Transport,
Sustainable Development and Climate Change
The 20 SLOCAT Quick Wins on Transport, Sustainable Development and Climate Change is a course of immediate, bold and ambitious action for shifting the transport paradigm towards an equitable 1.5ºC Planet. The Transport Quick Wins were proposed through a wide consultation conducted by the SLOCAT Partnership with a broad set of transport experts and other stakeholders, and have been evaluated through multifaceted impact analysis. They are:
- Tested at scale and are replicable with the possibility for large-scale impact;
- Technically and economically feasible in both developed and developing countries using available technologies;
- Available for both passenger and freight transport, with a reasonable balance between the two, and relevant to the Avoid-Shift-Improve Framework.
These actions have the potential to contribute toward reducing GHG emissions, thereby moderating climate impacts, while at the same time providing key sustainability benefits. Stakeholders should take into consideration the Transport Quick Wins in the strategic planning, implementation, evaluation and review process of the SDGs.
Further studies
- Quick Wins on Transport, Sustainable Development and Climate Change (2016)
SLOCAT Partnership - Low-Carbon Quick Wins: Integrating Short-Term Sustainable Transport Options in Climate Policy in Low-Income Countries (2019)
Stefan Bakker,* Gary Haq, Karl Peet, Sudhir Gota, Nikola Medimorec, Alice Yiu, Gail Jennings and John Rogers
[/vc_column_text][/vc_column][/vc_row][vc_row][vc_column][vc_tta_accordion color=”white” active_section=”non-existing number” no_fill=”true” collapsible_all=”true”][vc_tta_section i_icon_fontawesome=”fas fa-smog” add_icon=”true” title=”Reduce black carbon” tab_id=”1596442735331-cd7d452d-b9e1″][vc_column_text]
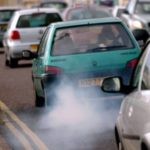 Accelerate deployment of tighter diesel fuel quality standards to reduce emissions of black carbon and other short-lived climate pollutants
Extending the vehicle emissions and fuel-quality standards already in force in the largest vehicle markets throughout the rest of the world could reduce the number of premature deaths caused annually by vehicle fine particle emissions by 75% in 2030. Additionally, doing so would have the added benefit of reducing near-term climate impacts through reductions in black carbon and other short-lived climate pollutants, to the equivalent of 710 million metric tons of CO2 annually.
Characterisation
- Applicable to both passenger and freight transport, with the latter dominant due to proportionally greater air quality impacts from freight vehicles.
- Action primarily focused on road transport (including both freight and passenger modes), but has potential correlates in rail, aviation and maritime.
- Extending the vehicle emissions and fuel-quality standards already in force could reduce near-term climate impacts through reductions in black carbon and other short-lived climate pollutants to the equivalent of 710 million metric tons of carbon dioxide (CO2) annually. Fast action to reduce short-lived climate pollutants has the potential to slow down the warming expected by 2050 by as much as 0.5°C.
- Extending the vehicle emissions and fuel-quality standards already in force in the largest vehicle markets throughout the rest of the world could reduce the number of premature deaths caused annually by vehicle fine particle emissions by 75% in 2030. Fast action to reduce short-lived climate pollutants has the potential to prevent over two million premature deaths each year and avoid annual crop losses of over 30 million tons.
Status of deployment
Historically, technical interventions to control diesel black carbon emissions in developed countries have relied on fuel quality improvements and vehicle emissions standards. Black carbon emissions are projected to decline due to policies implemented in the United States, Canada, Europe, and Japan; however, global emissions are projected to increase in the next decade as vehicle activity increases, particularly in East and South Asia.
Estimated Impact
- The World Health Organization (WHO) has estimated that in 2012 around 7 million people died as a result of air pollution exposure. This finding more than doubles previous estimates and confirms that air pollution is now the world’s largest single environmental health risk. Reducing air pollution could save millions of lives. A recent analysis has also shown that if all regions accelerated their progress toward fuel quality and vehicle emission standards best practice policies, global emissions of health-related pollutants and short-lived climate pollutants could be cut by three-quarters below 2000 levels even with a 150% increase in vehicle activity.
- With science indicating that one kilogram of black carbon causes as much climate impact in the near term as 3,200 kilograms of CO2, diesel vehicles in particular are now a prime target for policies aimed at controlling black carbon emissions. For example, in the global high shift scenario, in which governments significantly increase infrastructure and investments on high quality public transit, walking, and bicycling, the future growth in vehicle activity could still produce a four-fold increase in associated early deaths from urban traffic related air pollution by 2050. However, about 1.4 million early deaths could be avoided annually by 2050 if countries commit to a global policy roadmap that requires the strongest vehicle pollution controls and ultra low-sulfur fuels. Cleaner buses alone would account for 20% of these benefits.
- In Tokyo, more stringent particulate matter (PM) emissions standards caused PM10 levels to drop from 50Mg/m3 in the early 1990s to 23 Mg/m3 in 2009. Under the GFEI, Mauritius implemented measures to bring down diesel with a sulfur content of 5000 ppm to less than 50 ppm, and introduced unleaded petrol in September 2002.
[/vc_column_text][/vc_tta_section][vc_tta_section i_icon_fontawesome=”fas fa-hand-holding-usd” add_icon=”true” title=”Eliminate fossil fuel subsidies” tab_id=”1596442735332-3985cc1b-a1a4″][vc_column_text]
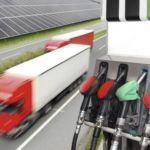 Accelerate phase-out of fossil fuel subsidies
Global fossil fuel subsidies total US$600 billion per year, and subsidy reform can help reduce and shift vehicle trips, thus decreasing emissions and air pollution. Consumer fossil fuel subsidy removal in the area of transport could have significant air quality impacts in rapidly growing cities in developing countries, as gasoline and diesel pollution in congested urban centers take a growing toll on public health.
Characterisation
- As an economy-wide measure, fossil fuel subsidy reform (FFSR) has the potential to apply comparably to passenger and freight transport.
- Fossil fuel subsidy reform applies to all motorized transport modes, including aviation and shipping.
- Reduces GHG emissions by creating disincentives for conventional private motorization, and thus incentivizing shift to more efficient transport modes, and reducing unnecessary trips. By reducing market distortions, fossil fuel subsidy reform can also increase the reliability of fuel supplies for more sustainable transport modes (e.g. high-quality bus systems).
- Supports sustainable development objectives by reducing vehicle traffic, and thus reducing air pollution and increasing road safety. Crucially enables subsidies to be re-directed toward sustainable transport measures and other supportive SDGs.
Status of deployment
India, Indonesia and Egypt all undertook FFSR in 2015. Some countries have invested in social measures to offset the costs to citizens of rising oil prices during the process of reform (as in Indonesia, the Philippines and Iran). Other countries have chosen to invest back into the energy sector and towards renewables (such as Morocco and Ethiopia).
Estimated Impact
- At present the transport sector is the least diversified energy end-use sector, with about 93% of the sector driven by oil. It has been established that the market attractiveness of policies in favor of decarbonizing fuel depends upon the removal of fossil fuel subsidies, as current fossil-fuel alternatives are likely to remain uncompetitive in market segments with subsidized fuels. Current subsidy arrangements for oil in transport not only obscure the direct costs of producing and distributing fuels, they also neglect the costs incurred by negative externalities, and thus give unfair advantage to oil over cleaner fuels.
- The International Energy Agency (IEA)’s latest estimates indicate that fossil-fuel consumption subsidies worldwide amounted to $493 billion in 201. However, completely eliminating fossil-fuel consumption subsidies in net importing countries within the next ten years, and in net exporting countries (with the exception of Middle East) by 2030, would make it possible to deliver a peak in global energy-related emissions by 2020. By eliminating fossil fuel subsidies, countries could derive an average 2-13% reduction in carbon emissions, and this reduction could be further increased if the savings are reinvested into energy efficiency and renewables.
- A study estimates that in Mexico, 34 million tons of CO2 could be saved every year from 2014-2035, through a mix of Green Growth Transport measures including FFSR, giving a net present value (NPV) of USD $193,300 million in that period. The fiscal space created by subsidy savings in Indonesia has allowed increased funding for state-owned enterprises, including in transport.
- There is a large variation among mitigation estimates due to consideration of different sectors and diversity regarding the intensity of subsidisation. There are several co-benefits to fossil fuel reform, with evidence suggesting that the economic, social and environmental benefits of FFSR are significant, as resources could be used more efficiently. A combination of subsidy reform and corrective taxes on fossil fuels could result in a 23% reduction in air pollutants and a 63% decrease in deaths worldwide from outdoor fossil fuel air pollution, and could also lead to an increase in global Gross Domestic Product (GDP) of up to 0.7% per year to 2050.
[/vc_column_text][/vc_tta_section][vc_tta_section i_icon_fontawesome=”fas fa-share-alt” add_icon=”true” title=”Car and e-bike sharing” tab_id=”1596443823745-7621fc43-bc10″][vc_column_text]
 Expand car and (e-)bike sharing systems in primary and secondary cities
Research suggests that car sharing may offer considerable environmental and social benefits, such as carbon emission reductions and greater use of alternative modes such as public transit, walking, and cycling, and reduced parking investments due to reduced ownership and use of vehicles. Surveys carried out in six European cities and three U.S. cities have indicated that car sharing could result in a 30% to 40% reduction in annual vehicle travel per driver, which could yield significant co-benefits.
Characterisation
- Action applies specifically to passenger transport.
- As noted in title, action applies to car and bike sharing, with limited potential for expansion to other modes.
- Current evidence suggests that there is a minor to moderate level of impact on CO2 emissions by bike sharing schemes, mainly due to significant shift from sustainable modes of transport like walking and public transport, and to the use of motorized fleets for bike maintenance and re-distribution. However, evidence also suggests that scaling-up bike share systems has led to dramatic increases in private bike use in many cities.
- Car sharing has the potential to reduce car ownership, and in turn can reduce parking demand (and thus positively impact commercial and residential parking requirements in the long term). Bike sharing is associated with a decreased risk of bicycle injuries compared to private bike riding and offers the potential for positive effects on local economic activity.
Status of deployment
Car sharing operations can be found in 33 countries on five continents for a total of approximately 4.8 million members. Europe accounted for a plurality of car sharing memberships, at 46%, with North America in second place at 34%. Bike share schemes have been implemented in more than 800 cities worldwide, with China well in the lead; European cities contribute the bulk of the remainder, with the Americas quickly ramping up efforts, thus demonstrating a truly globally-scalable action.
Estimated Impact
By extrapolating past trends in car sharing membership growth, the IEA has estimated that scaling-up car sharing programs could achieve average mitigation of about 0.45% of transport sector emissions by 2030. By 2050 about 25 million individuals could participate in car sharing, resulting in a reduction of about 11.81 million tons of CO2.[/vc_column_text][/vc_tta_section][vc_tta_section i_icon_fontawesome=”fas fa-chalkboard-teacher” add_icon=”true” title=”Capacity building programs” tab_id=”1596443977204-c6145f32-0266″][vc_column_text]
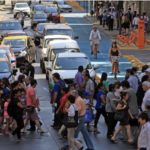
 Expand city transport official training programs to build local capacity for sustainable transport in primary and secondary cities
Increased training, mentoring, and partnering programs for national and international city transport officials in the field of urban mobility can allow the community of mobility decision-makers and practitioners to more comprehensively incorporate current knowledge, trends, and developments.
Characterisation
- Capacity building efforts to date have primarily focused on passenger transport, but training modules could potentially be expanded to incorporate freight-focused topics.
- Training can focus on a range of modes and themes, including bus, Bus Rapid Transit (BRT), and mass transit planning and regulation; non-motorized transport; public awareness and behavior change; and TDM.
- Capacity building can help to address the challenges related to climate change mitigation in the transport sector, and can outline options and instruments to address these issues by presenting policy options and their potential to reduce CO2 emissions. Transport decision-makers in developing countries are increasingly confronted with extreme weather events, and training modules can raise awareness of expected impacts of climate change on urban transport and present possible adaptation measures.
- Urban mobility is a basic necessity for the social and economic development of people, cities and countries. Capacity building aims at sharing knowledge on sustainable urban mobility planning, stakeholder involvement (public and private) and the importance of participatory inclusion during the process. Training can introduce various aspects from the use of financial resources at local levels, the alignment of local activities and societal goals and challenges in mobility planning.
Status of deployment
- Since 2003, GIZ SUTP has trained people from Africa, Asia and Latin America on topics ranging from fuel policies to public awareness, in 1 to 10-day courses to improve transport policies in those cities. In 10+ years of developing capacity in local governments, planners and citizens on sustainable urban transport, GIZ SUTP has delivered nearly 150 courses and has trained 5000 participants.
- Planned and completed workshops include topics such as bus maintenance in Latin America, joint training courses in Asia with the Islamic Development Bank, and a module at the EcoMobility Festival in Johannesburg.
Estimated Impact
- Today, about 3.9 billion (equivalent to 54%) of the world’s population resides in urban areas and projections suggest that world’s population could add another 2.5 billion to urban populations by 2050. Transport in urban areas accounted for about 2.3 Gigaton (Gt) of CO2 in 2010, about one third of carbon emissions and energy consumption from all segments of the transportation sector. BAU projections suggest that urban transport energy consumption to double by 2050, despite ongoing vehicle technology and fuel-economy improvements.
- In many cities, transportation is the largest or second largest source of local air pollutants such as carbon monoxide (CO), sulfur dioxide (SO2), nitrous oxide (NOx), and PM. Urban air pollution is now linked to up to 1 million premature deaths and 1 million premature deaths each year, which costs approximately 2% of GDP in developed countries and 5% in developing countries. Traffic congestion is another key source of urban transportation externalities with a share of 1-5% of GDP. Planning sustainable urban mobility contributes significantly to the reduction of urban transport externalities, i.e. air pollution and road congestions, improves road safety, and favors more inclusive urban transport and more prosperous cities.
[/vc_column_text][/vc_tta_section][vc_tta_section i_icon_fontawesome=”fas fa-truck” add_icon=”true” title=”Sustainable freight recognition schemes” tab_id=”1596444096750-9e733abb-3c29″][vc_column_text]
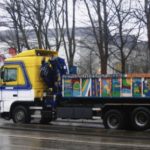 Expand sustainable freight recognition schemes to reward proactive carriers and shippers
Sustainable freight recognition programs can help to reinforce and disseminate best practices in urban freight transport, green logistics, co-modality, and e-freight. Potential areas of evaluation include freight vehicle operational efficiency, and improvements in sustainable distribution to reduce CO2 emissions, congestion, collisions and operator costs. Green freight performance benchmarking through key performance indicators can also assist cities to compare logistics performance and to identify solutions and suitable implementation opportunities.
Characterisation
- Exclusive focus on freight transport.
- Focus on road freight transport, as well as rail, aviation, and maritime freight transport depending on scope of recognition program.
- Since 2004, United States EPA SmartWay program has collectively achieved the following impacts: 72.8 million metric tons CO2 reductions, 1,458,000 tons NOx reductions, and 72,000 tons PM reductions.
- The United States EPA SmartWay program has saved 170.3 million barrels of oil, which is equivalent to taking over 14 million cars off the road for a full year and saving USD $24.9 billion in fuel costs since 2004.
Status of deployment
- There is a significant lack of performance benchmarking among cities in the transport sector, and thus tools could assist cities in comparing their logistics performance and identifying potential solutions and investment opportunities. One of the goals of the Clean Air Asia organization for 2016 is that Asian cities of more than 1 million regularly collect and report key freight data.
- The European Union initiative ‘Best Practice Factory for Freight Transport’ (BESTFACT) commenced in 2012 and is to be completed in 2016. The project is to examine best practices in urban freight transport, green logistics, co-modality, and e-freight, and has a broad modal scope, which includes road, rail, aviation, and maritime freight transport.
Estimated Impact
- Due to globalization, freight increasingly crosses borders and continents, and thus some factors that drive freight movements are largely beyond the control of any single government. There are multiple stakeholders involved in the freight sector and frequently they have different objectives. The relationship between stakeholders is likely to interchange amongst conflicts, cooperation, competition and “co-opetition”. This necessitates developing partnerships and a recognition program.
- A recognition program is often developed for motivating a defined set of stakeholders to change their behavior or performance in the direction strategically set by the organizer of the recognition program. A freight recognition program can be a simple labeling program, a monitoring program, or an awards program. The impact on transport emissions of a country could be in the 0.2% to 2% range, depending upon the type of freight recognition program, parameters considered, market size, type, and number of stakeholders.
- For example, the UK’s Logistics Carbon Reduction scheme (LCRS) is a voluntary industry initiative to record, report, and reduce carbon emissions. LCRS has a voluntary target of 8% reduction in emissions by 2015 when compared to 2010 levels. The latest monitoring reports suggest that by 2013, they had reduced freight emission intensity to 15% below 2005 levels. In the United States, the SmartWay system has cumulatively saved about USD $16.8 billion in fuel savings, 52 Mt of CO2 emissions (i.e. roughly 0.2% of 2010 transport emissions), 0.7 Mt of NOx emissions, and 37 kilo-tons of PM emissions from 2004 to 2013.
[/vc_column_text][/vc_tta_section][vc_tta_section i_icon_fontawesome=”fas fa-mobile-alt” add_icon=”true” title=”Enhance ICT applications” tab_id=”1596444212703-5c91d4bb-948b”][vc_column_text]
 Expand use of ICT applications for real-time travel information and route planning for walking, cycling, public transport and car-sharing
Real-time multimodal transit information and route-planning apps provide travelers with up-to-date information on transit options, stop locations, and scheduled and predicted arrival times. For example, an algorithm which calculates the best transfer points for a user to park her car and continue a trip by public transport can result in mode shift over time.
Characterisation
- A case study in Helsinki Capital Area using real time vehicle simulations has indicated that a driver can reduce their CO2 emissions by more than 50% by considering factors such as time, emissions, cost, and distance for planning a trip that involves multiple means of transportation。
- Sustainable development benefits include improved coordination of mobility options, reduced travel times, and increased personal security through reduced wait times in potentially dangerous public spaces.
Status of deployment
The majority of global examples are concentrated in developed country cities based on available telecommunication infrastructure, with developing countries making strides based on appropriate technologies (e.g. through cab hailing apps).
Estimated Impact
- In the United Kingdom, widespread deployment of real-time public transport information along with targeted marketing could decrease car travel demand by 1.8% to 6.0% in urban areas. Evidence from the Chicago Transit Authority’s Bus Tracker system establishes that the real-time transit information system has attracted a significant (if modest) number of new riders to the city’s bus system, suggesting that real-time transit tools can serve not only to increase the satisfaction of existing transit riders, but also to entice new ones.
[/vc_column_text][/vc_tta_section][vc_tta_section i_icon_fontawesome=”fas fa-walking” add_icon=”true” title=”Sustainable urban mobility plans” tab_id=”1596506151950-3690e96b-9771″][vc_column_text]
 Formulate Sustainable Urban Mobility Plans (SUMPs) in primary and secondary cities
Sustainable Urban Mobility Plans (SUMPs) can help developed, developing, and transitional cities and countries to design more livable and prosperous cities for all, as well as reduce congestion, road fatalities, noise and air pollution, and CO2 emissions. SUMPs can assist in developing long-term urban green freight policy to guide regulatory development and infrastructure investments, and can require all major traffic generators to develop and implement site-based mobility plans to manage their accessibility.
Characterisation
- SUMPs can apply equally to passenger and freight transport, and can be more effective when passenger and freight are combined within a comprehensive planning process.
- SUMPs include all urban transport modes, including walking, cycling, public transport, private vehicles, and freight vehicles.
- SUMPs have the potential to significantly reduce GHG emissions in urban areas by creating a more integrated urban mobility system, which helps to avoid unnecessary transport trips, shift passengers and goods to more efficient modes, and reduce trip lengths by improving access to key destinations. By increasing motorized and non-motorized transport options, SUMPs in effect can increase resiliency by increasing transport system redundancy.
- A SUMP seeks to contribute to the development of an urban transport system which is accessible and meets the basic mobility needs of all users, as well as balancing and responding to the diverse demands for mobility and transport services by citizens, businesses and industry, thus meeting the needs for economic viability, social equity, health, and environmental quality.
Status of deployment
- The Cooperation for Urban Mobility in the Developing World (CODATU) ‘MobiliseYourCity’ initiative aims to engage at least 100 cities in elaborating a SUMP between 2016 and 2020 for both passengers and freight, reduce CO2 emissions at least 50% by 2050, and build capacity to implement national sustainable urban mobility policies at the local level in 12-15 developing countries.
- WBCSD and 15 member companies have developed the Sustainable Mobility Project 2.0, a globally applicable, data-driven multi-stakeholder approach for developing SUMPs. This process has been tested in Chengdu, Bangkok, Indore, Hamburg, Lisbon and Campinas.
- In 2001 Budapest adopted a development plan for a city transport system, which was reviewed in 2009. In 2013 the city decided to reconsider the entire strategic planning process and develop a new transport development strategy for Budapest, the Balázs Mór Plan (BMT).
- The Green Zone for Transport in Santiago promotes sustainable urban transport through four initiatives: promoting zero or low emissions vehicles; developing a more efficient public transport system; promoting non-motorized transport; and increasing pedestrian spaces.
Estimated Impact
- In many cities, transport is the largest or second-largest source of local air pollutants such as CO, SO2, NOx, and PM. Urban air pollution is now linked to up to one million premature deaths and one million pre-native deaths each year, which accounts for approximately 2% of GDP in developed countries and 5% in developing countries. Traffic congestion is another key source of urban transportation externalities with a share of 1-5% of GDP.
- Planning sustainable urban mobility can contribute significantly to the reduction of urban transport externalities. For example, the EU Commission has estimated that the implementation of the comprehensive set of recommendations from the SUMP process in a given city can lead to a CO2 emission reduction of between 35% and 70% by 2040, with projected savings in public and private capital and urban transport operating costs in excess of $100 trillion until 2050, and a potential reduction of about 6% of global transport CO2 emissions by 2030.
[/vc_column_text][/vc_tta_section][vc_tta_section i_icon_fontawesome=”far fa-dot-circle” add_icon=”true” title=”Low emission zones” tab_id=”1596506284892-be04cfaa-af63″][vc_column_text]
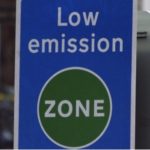 Implement (ultra-) low emission zones, including car-free zones in city centers
Low emission zones (LEZs) are a regulatory measure in which access is restricted in a defined area for polluting vehicles (i.e. vehicles with higher emissions cannot enter the area or have to pay higher charges for access). The main driver of LEZs is to reduce air pollutant emissions; particularly those with the greatest health impacts, while co-benefits of this strategy include reduced CO2 emissions and stimulated growth of low emission vehicles.
Characterisation
- Action applies to both passenger and freight vehicles, but is likely to have greater implications for the latter due to generally lower emissions standards for high-duty vehicles (HDVs).
- Action applies generally to cars and trucks, but has potential for expansion to public transport vehicles as well.
- There would likely be no GHG emission benefits for most LEZ options; however, the introduction of Euro 4 vehicles could yield some carbon reductions.
- Research from London and Berlin indicates that the implementation of an LEZ could result in approximately 15% reduction in NOx and a 30% reduction in PM10. A proposed ultra-low emission zone (ULEZ) in London is expected to deliver a 51% reduction in NOx emissions, a 64% reduction in PM10 and a 15% reduction in CO2 emissions from road transport by 2020.
Status of deployment
The majority of global examples are concentrated in European cities, though the concept is being explored in China as well, and Hanoi is considering a general motorbike ban.[/vc_column_text][/vc_tta_section][vc_tta_section i_icon_fontawesome=”fas fa-truck-loading” add_icon=”true” title=”Zero emissions urban freight” tab_id=”1596506398025-5de4faaf-8d8b”][vc_column_text]
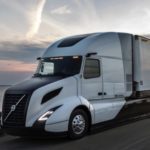 Improve freight efficiency (e.g. reduce empty load running by freight trucks) through route optimization, asset sharing between companies, and increased use of ICT solutions
Truck transport accounts for about 25% of global transport energy use. Every year American trucks travel empty for 50 billion miles, 28% of their total mileage, and in Europe a quarter of containers on the road are empty. Empty runs have high economic costs due to the wastage of fuel, time, labor, and traffic congestion involved. The UK transport industry could save over 40 million miles of empty journeys by making use of spare vehicle capacity.
Characterisation
- This action has an exclusive focus on freight transport.
- Empty runs are focused here on long-distance trucks, but can also apply to shipments by rail, air, and inland and maritime shipping.
- HDVs (trucks, buses and coaches) produce about a quarter of CO2 emissions from road transport in the EU and some 5% of the EU’s total greenhouse gas emissions – a greater share than international aviation or shipping. Making use of spare vehicle capacity could cut UK carbon emissions by as much as 8% and contribute to a more sustainable transport industry.
- Green freight programs, including reducing empty running, can accelerate the adoption of advanced technologies and strategies across the entire transport sector that save fuel, reduce costs for business, and lead to significant reductions of CO2, black carbon, PM, and other air pollutant emissions. The most successful programs deliver major business benefits by incentivizing investments in fuel saving and emission reducing technologies, as well as operational strategies.
- Status of deployment:
- Digital technologies can help consolidate the fragmented and often inefficient trucking industry. Replacing shipping brokers with mobile-app platforms that dynamically match shippers’ loads with available trucks and truckers can reduce empty loads. In 2014, USD $63 million was raised for seven online freight matching platforms, including $12 million for Transfix and $20 million for Truckloads. Teleroute is a pan-European online freight and vehicle exchange service that improves operational efficiency, with a goal to reduce empty running by 43%. Over 200,000 real-time freight and vehicle offers are posted every day on their freight exchange in 27 European countries. In the past 12 months alone, the online freight company Returnloads.net has saved UK haulage companies and couriers over 300,000 otherwise wasted journeys.
Estimated Impact
- Logistical activity accounts for roughly 5.5% of total GHG emissions. Within the logistics sector, freight transport accounts for around 90% of total GHG emissions and 35-60% of logistics costs. However, due to lack of adequate freight information, fragmentation of the freight industry, unbalanced freight movements, and oversupply in the trucking market, in many developed and developing countries, empty trips constitute 20-50% of overall freight trips.
- By reducing empty trips, freight efficiency could be improved, leading to several co-benefits e.g. reduced logistics cost, reduced congestion, and reduced carbon and air pollutantsAn example of high co-benefits is found in the Henan Anyang Modern Logistics Information platform in China, which has helped trucking companies reduce the empty mile percentage from 53% in 2006 to 38% in 2008, resulting in an average empty trips reduction of about 44 million kilometers, and yielding fuel savings of 8.8 million liters, equivalent to about ¥52.7 million.
- At a national level, this could result in 1-4% reduction in transport CO2 emissions by 2030, considering market size and geographic imbalance of freight movement within each country. For example, Nigeria aims to develop an action plan to improve the efficiency of freight handling and transport, which is projected to result in a reduction in transport CO2 emissions of about 3.8% by 2030.
[/vc_column_text][/vc_tta_section][vc_tta_section i_icon_fontawesome=”fas fa-motorcycle” add_icon=”true” title=”Improve freight efficiency” tab_id=”1596506589109-5c26d5fd-9910″][vc_column_text]
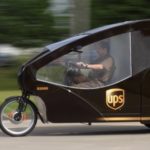 Implement zero-emissions (last-mile) urban freight through e-mobility and cycling solutions
Last-mile freight delivery has a high potential to incorporate electric or non-motorized transport to reduce impacts in the final leg of freight pathways. Technological solutions can be combined with freight demand management, which can encompass strategies such as staggering deliveries across time of day, mandating off-hour deliveries, and consolidating deliveries. Successful last-mile freight demonstration projects could be scaled up further, and could be implemented even more quickly with private sector support.
Characterisation
- Action is focused on freight transport, though success in this area requires careful operational and planning coordination with a range of passenger modes.
- An innovative zero-emission urban freight plan will require use of both motorized (electric) and non-motorized modes, including two-, three-, and four-wheelers as context-appropriate.
- Urban freight contributes to 40-50% of total CO2 emissions in China; thus, a move to zero-emission last-mile freight solutions can have a substantial impact. Latest estimates from the International Transport Forum (ITF) suggest that in OECD countries, freight transport is expected to grow between 50% and 130% between 2010 and 2050; in non-OECD countries, freight activity is expected to grow 250% to 550% in the same time span.
- It is estimated that if all pre-Euro and Euro 1 freight vehicles were replaced with Euro 4 model compliant vehicles, significant improvements in roadside air quality would be realized, with vehicle emissions of RSP and NOx reduced by 74% and 38% respectively. A good example for scrapping old trucks is the one time incentive measure adopted by Hong Kong in 2007.
Status of deployment
National or regional green freight programs are being established around the world with most modeled after the US SmartWay program. China is the first Asian country where a national program is being established; in addition, a growing number of green freight initiatives are being implemented in Japan, Australia, France, and the United Kingdom.
Estimated Impact
- Freight travels through multiple jurisdictions, generating a disproportionate share of traffic related externalities such as congestion, air pollution, greenhouse gases, and traffic fatalities. Urban freight comprises one of the most cost-sensitive and emission intensive segments of the supply chain. Urban freight constitutes only fraction of total vehicle ownership (less than 10% in many developing cities), however, it constitutes a significant share of urban transport externalities (i.e. about 15-25 % share of urban vehicle kilometers, 20-40 % of motorized road-space occupation, 20-40 % of urban transport CO2 emissions and about 30-50% of urban transport air pollutants in cities of developed economies and sometimes higher than 50% for cities in developing countries). The expected growth in road freight movement has direct consequences for congestion, air pollution, and GHG emissions. Estimates reveal that every year €100 billion, or 1% of the EU’s GDP, is lost to the European economy as a result of delays and pollution related to urban traffic.
- Since urban freight emits about 6% of all transport GHG emissions, a proportionate savings of 6% from the transport sector is possible by 2030. For example, in the European Union, on average half of all motorized trips in cities that involve transport of goods could be shifted to (cargo) bikes, which could result in significant environmental and climate benefits. In Copacabana, Rio de Janeiro, implementation of bike cargo has resulted in an annual savings of 300 tons of CO2, 5 tons of CO, 630 kilograms of hydrocarbons (HC), and 360 kilograms of NOx. Furthermore, non-motorized delivery vehicles in Copacabana save 9,600 m2 of parking space.
- The introduction of a zero emission electric vessel in Utrecht, the Netherlands, gave immediate emission reductions of 38 tons of CO2, 31 kilograms of NOx and 6 kilograms of PM10. For total estimated city center emissions, this means decreasing CO2 emissions by 13%, NOx emissions by 6% and PM10 emissions by 10% over the project lifespan. The 2011 Transport Sector White Paper set an ambitious target of achieving essentially CO2 free city logistics in major urban centers by 2030 based on detailed investigations. Thus, by promoting zero-emissions urban freight delivery, emissions could be significantly reduced.
[/vc_column_text][/vc_tta_section][vc_tta_section i_icon_fontawesome=”fas fa-bus-alt” add_icon=”true” title=”Efficient bus-based transit” tab_id=”1596506747634-ff7974c7-e950″][vc_column_text]
![]() Increase quality, availability, reliability, frequency, and efficiency of bus-based transit
Increase quality, availability, reliability, frequency, and efficiency of bus-based transit
Bus Rapid Transit (BRT) and other high-quality bus-based transit systems can deliver fast, comfortable, and cost-effective services, through a combination of dedicated lanes; off-board fare collection and expanded use of smart cards; and fast and frequent operations. Because high-quality bus systems include features similar to light rail and metro systems, they are more convenient and reliable than regular bus services, and are able to avoid causes of delay that typically slow regular bus services, such as being stuck in traffic and queuing to pay on board.
Characterisation
- Action has direct focus on passenger transport, although the planning of high-quality bus systems requires the resolution of potential freight transport conflicts (i.e. delivery times and locations).
- Action has direct focus on bus transport, though successful high-quality bus systems are often coordinated with connections to metro or light rail transport, and improvements to cycling and pedestrian facilities.
- BRT projects registered in the Clean Development Mechanism (CDM) pipeline as of June 2011 have the potential to reduce more than 12.2 million tons of CO2 equivalent during their crediting periods, a 40% reduction over baseline conditions. Implementation of TransMilenio in Bogota, combined with new regulations on fuel quality, is estimated to save nearly 1 million tons of CO2 per year.
- By reducing local pollutants, Metrobús Line 1 in Mexico City eliminates more than 6,000 days of lost work, 12 new cases of chronic bronchitis, and three deaths, saving an estimated USD $3 million per year. In Seoul, proximity to a BRT station increases property values by 5 to 10%, and rental prices decrease 1.3% for every minute of walking time from a BRT station.
Status of deployment
- BRT systems currently operate in more than 200 global cities, and have traditionally been implemented in the developing world, notably in Latin America and Asia, to provide high-capacity and high-quality transport at a fraction of the cost of metro rail systems. Bogota’s TransMilenio system helped galvanize support for a national plan to expand BRT to eight other Colombian cities.
Estimated Impact
- Improving public transport systems (i.e. by decreasing travel times and improving transport services), could achieve a significant modal shift from private vehicle travel. The most cost-effective urban transport strategy is often improvements to bus operations, by replacing inefficiently run small buses with high capacity, fuel efficient buses operated on dedicated rights-of-way.
- Globally more than 200 cities have adopted Bus Rapid Transit (BRT) systems with over 5,300 BRT lane kilometers already in operation. These systems often lead to more efficient utilization of scarce street space in terms of person-movements per meter of roadway. By improving public transport systems, a 0.1% to 15% reduction in transport emissions could be achieved by 2030.
- Recent evidence suggests that development of 1,000 km of BRT lines in 15–20 cities across India within six years and would result in significant socio-economic-environmental benefits between 2013 and 2032 including the following:
- 1,100 to 1,350 reduced traffic fatalities per year;
- 1.9 to 2.3 million tons per year of CO2 emissions reduction;
- Annual savings of 300 tons of black carbon;
- US$6.4 to 8.1 billion in macroeconomic benefits (over 20 years);
- 50,000 to 90,000 short-term jobs, rising to 128,000 permanent new jobs;
- More than 175 avoided deaths annually because of improved air quality;
- More than USD $500,000 in annually avoided crop losses due to air pollution;
- 500 million hours/year of time savings because of shortened trips.
- The TransMilenio BRT system in Bogotá has decreased average travel times by 32%, increased property values along the main line by 15-20%, and improved the health and safety of the community. The Guangzhou Bus Rapid Transit System yields a projected saving of 84,000 tons of CO2 emissions per year and reduces 14 tons of particulate matter annually.
- It is important, however, to note that not all public transport investment has the same potential to reduce CO2 emissions. Poorly designed systems, which shift few motorized trips away from higher carbon modes of transport may cost more in embedded GHGs to build than they reduce over their lifetime of operations. Poorly operated services may produce higher CO2 emissions per passenger-km than competing private motor vehicle transportation.
[/vc_column_text][/vc_tta_section][vc_tta_section i_icon_fontawesome=”fas fa-parking” add_icon=”true” title=”Car-related travel pricing” tab_id=”1596506870966-d06e30d8-bc53″][vc_column_text]
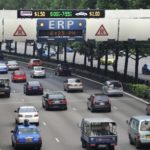 Introduce and scale up pricing for car-related travel options (e.g. congestion/road charging, parking pricing) in primary and secondary cities
Congestion charging refers to variable road tolls that are intended to reduce peak-period traffic volumes to optimal levels (i.e. higher prices are applied under congested conditions and lower prices are applied at less congested times and locations). Tolls can vary based on a fixed schedule, or they can be dynamic, changing depending on real-time levels of congestion. Tolls may also provide exemptions for zero-emission vehicles to help to drive e-mobility as a key mitigation strategy. Congestion charging can be implemented to raise revenue or as a demand management strategy to avoid the need to add roadway capacity.
Characterisation
- Action impacts both passenger and freight transport relatively equally, though specific policy formulation can target particular vehicle types for higher (or lower) congestion charges.
- Action is focused primarily on cars and trucks, though ideally a portion of revenue generated from congestion charging will be reinvested in public and non-motorized transport improvements.
- A small reduction in urban-peak traffic volumes can provide a large reduction in congestion delays. A study modeling the effects of congestion pricing found that a fee averaging USD 19¢ per mile in congested conditions would reduce total vehicle trips by about 3.3%, but congestion delay would decline by 32%. An experiment involving time- and mileage-based pricing found that motorists reduced peak-period trips by 22%, peak mileage by 25% and total mileage by 12%.
- By reducing total vehicle travel and traffic congestion, road pricing can provide significant energy conservation and emissions reductions, and therefore improved urban air quality. Congestion pricing benefits are potentially very large, because the policy is usually applied on the most congested urban roadways where socio-economic costs (e.g. driver stress, freight delays) are particularly high.
Status of deployment
Congestion charging generally occurs on a city-by-city basis; thus there are no overarching policy initiatives to expand charging on a global basis. Implementation is currently limited to a handful of cities, with Singapore one of the few representatives from the global South.
Estimated Impact
- In many large cities, congestion costs are estimated to be 1-5% of national GDP. Average congestion costs in cities like Rio de Janeiro and São Paulo amounted to roughly USD $43 billion in 2013 (or about 2% of Brazil’s entire GDP). Considering high economic costs and externalities caused by traffic congestion, congestion charging aims to reduce congestion within a specified area and derive economic and social benefits.
- Congestion charging could reduce national transport sector emissions 1-3% by 2030. For example, the London congestion charge, which was implemented in 2003 and costs about £45m to operate annually. Over its 10 years of operation, the scheme has generated over £1bn in net revenues. Furthermore, it has reduced the number of traffic accidents in London by 40% since 2003.In addition to these co-benefits, this scheme has aided transport investments, with annual funding at about £194.2 million in 2013.
- The Stockholm Congestion Pricing program has reduced traffic volumes by about 25%, removing 100,000 vehicles from the roads during peak business hours and increasing public transit ridership by 40,000 users per day. Due to the implementation of this scheme, retail sales in central Stockholm shops have increased significantly since 2005, reflecting increased purchases by residents who are more likely to shop locally than drive to the shops.
[/vc_column_text][/vc_tta_section][vc_tta_section i_icon_fontawesome=”fas fa-tags” add_icon=”true” title=”Introduce carbon pricing” tab_id=”1596507000469-91a4927f-88ba”][vc_column_text]
 Introduce carbon pricing for the transport sector where (sub-) national carbon markets currently exist or are under development.
Carbon taxes tend to provide greater total benefits than many other energy conservation and emission reduction strategies, since they also yield co-benefits such as reduced congestion, road and parking costs, accidents, and sprawl. Implementation costs are minimal, since most jurisdictions already collect fuel taxes, and it is estimated that each 10% fuel price increase reduces total automobile deaths by 2.3%.
Characterisation
- As an economy-wide measure, carbon taxes have the potential to impact both passenger and freight transport.
- Carbon taxes can apply to all motorized transport modes, including aviation and shipping.
- Currently about 40 countries and 23 cities, states, and provinces put a price on carbon; together, these cover the equivalent of some 7 billion tons of CO2 – a threefold increase over the past decade. Removing subsidies and fully taxing carbon could reduce global CO2 emissions by 23%.
- By removing subsidies and taxing carbon, government savings in revenue/taxation could be raised to the equivalent of 2.6% of global GDP, which could be re-directed toward sustainable transport measures and other complementary SDGs. Although fuel taxes are regressive, targeted tax reductions, cash rebates, and improved services for poor people tend to be extremely progressive, and revenue-neutral carbon taxes can also be progressive.
Status of deployment
- At its COP21 launch, 21 governments and more than 90 business and strategic partners had joined the Carbon Pricing Leadership Coalition (CPLC). On April 15, 2016, the CPLC agreed to advance global progress on carbon pricing systems, and to regularly report on said progress. It called for accelerated business support for carbon pricing policies, including through the use of internal carbon prices.
- A carbon tax of €15 per ton of CO2 was introduced in Ireland in 2010, covering most emissions from non-traded sectors (including transport), which has since increased to €20 per ton. A tax of USD $5 per ton CO2 is scheduled to take effect in Chile in 2018. The proposed tax only affects electricity and does not apply to the transport sector.
Estimated Impact
- Carbon pricing is based on the ‘polluter pays’ principle, i.e. it gives an economic signal which allows polluters to decide for themselves whether to discontinue their polluting activity, or continue polluting and pay for it, thereby stimulating innovations in technology and markets.Thus the impact of carbon pricing on transport CO2 emissions could be significant, with an estimated 0.5-10% reduction in CO2 emissions by 2030. High variation in emissions impact estimations may be due to assumptions involved in modes, market segment and carbon price.
- In the United States, a comparison of expected light-duty vehicle (LDV) emissions modeled with and without carbon pricing shows a 3% reduction in CO2 emissions and a 0.4% reduction in vehicle travel for LDVs.[1] In China, transport emissions mitigation could be in the range of 0.5-10% depending upon the carbon price, with significant air pollution mitigation co-benefits.In 2050, under a 10 ¥/ton CO2 tax scenario, the annual CO, HC, NOx, and PM emissions would be reduced by 0.68%, 0.66%, 0.55% and 0.49% respectively when compared with BAU. Under a 300 ¥/ton CO2 tax scenario, they would be reduced by 15.1%, 14.1%, 10.1% and 8.3%, respectively, compared with BAU.
- However, there is also evidence that if not planned properly, CO2 taxation could be far less effective than fuel and energy taxations, or could even impose negative consequences on economies throughout the automotive sector.However, if planned properly and if supported by additional complimentary policies such as the removal of fossil fuel subsidies, carbon taxes have a significant role to play in emissions mitigation, with potential for a global 23 % reduction in (economy-wide) CO2 emissions.
[/vc_column_text][/vc_tta_section][vc_tta_section i_icon_fontawesome=”far fa-compass” add_icon=”true” title=”Car-free days/ ciclovías” tab_id=”1596507114091-ea33fdb2-c1a7″][vc_column_text]
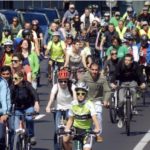 Introduce car-free days and ciclovías (temporary street closures to encourage cycling and walking) in primary and secondary cities to build support for longer-term policies.
Car-free days and ciclovías involve closing city streets to motorized traffic and opening them completely to pedestrians and cyclists, in order to promote physical activity and encourage people to use an alternative to private motorized transport as a part of their daily routine. It is important to note that car-free days and ciclovías provide a modest GHG emissions reduction benefit, as they are often voluntary and usually implemented across few streets for a limited duration; nevertheless, they can lead to longer-term transit behavioral change.
Characterisation
- Both passenger and freight are subject to travel restrictions, with potential non-motorized beneficiaries in each area.
- Travel restrictions are focused on motorized vehicles, with benefits accruing to non- motorized modes (cycling and walking).
- CO2 benefits from car-free days/ciclovías are likely to be less pronounced than the sustainable development benefits from reduced levels of congestion and local air pollutants.
- Airparif, which measures Paris pollution levels, said levels of NOx dropped by up to 40% in parts of the city during its first car-free day. A report by the French Sénat (upper house of parliament), found that air pollution costs France €101.3bn (£75bn) a year due to negative health, economic and financial consequences.
Status of deployment
Ciclovías are a strategy with reasonably balanced representation in the developing and developed worlds. In Seoul, residents are encouraged once a week to leave their cars at home as part of the city’s No Driving Day program.s Due to this initiative, traffic volumes have been reduced by 3.7%, CO2 emissions by 10%, and fuel costs by $50 million annually. Economic analysis of ciclovía events in Bogota suggests that savings in direct medical costs ranged from USD $3.2 to USD $4.3 for every dollar invested in the Ciclovía program. 22 million people have participated in the European Car Free Day campaign and over 85% want it regularly repeated, with 44% of Paris residents requesting a weekly car free day.[/vc_column_text][/vc_tta_section][vc_tta_section i_icon_fontawesome=”fas fa-road” add_icon=”true” title=”Rural road maintenance” tab_id=”1596507272504-0d2ed4ee-dee6″][vc_column_text]
 Invest in rural road maintenance and modern supply chains to reduce global food loss and waste
Curbing food waste will not only boost food security, but will also improve livelihoods, reduce GHG emissions, and save land and water. Reliable transport is an essential factor in reducing food loss, which requires additional investments in rural road construction and maintenance, and the increased availability of rural transport services to provide regular all-season means for getting agricultural products safely to domestic and global markets.
Characterisation
Action focused primarily on freight transport, acknowledging that in rural areas, produce from smallholders is often commingled among mixed passenger-freight vehicles.
Action focused primarily on motorized modes of road transport, though improvements to rural roads also increases the effectiveness of intermediate modes of transport that provide ‘first mile’ access for agricultural products.
According to a study by the UN Food and Agriculture Organization (FAO), food loss and waste accounts for about 3.3 Gt of greenhouse gas emissions every year, an annual emission level only exceeded by China and the United States. In addition, large amounts of water and fertilizer go into the production of this food, creating further GHG emissions.
Globally, food worth USD $750 billion is lost or wasted each year throughout the supply chain, and reducing food loss and waste could help to reduce financial burdens on the world’s most vulnerable people. In Sub-Saharan Africa alone, the World Bank estimates that a 1% reduction in post-harvest losses could lead to economic gains of USD $40 million each year, which will depend in part upon more reliable rural transport options.
Status of deployment
45% of the land area in low-income countries (LICs) and 51% in the lower middle-income countries (MICs) is located more than five hours away from the next market. About half the agricultural area in these remote regions has sufficient agricultural potential, but lacks infrastructure for proper integration into the wider economy; thus, additional strides must be made.
In India, the Prime Minister’s Rural Roads Program was launched in 2000 with the aim to provide all weather farm-to-market connectivity to all population centers of more than 500 people. A key development has been more transparent and rational organization and planning procedures, which allows road funds to be used to increase efficiency and sustainability.
Estimated Impact
- Rural road quality improvements are a crucial means of access for rural people to employment opportunities and essential services. While improvement of rural roads may necessitate some nominal increases in construction emissions, these are small relative to the benefits in terms of improved access to hospitals, education, markets, and services for otherwise isolated and often poor rural communities. Providing access to such services is likely to raise rural incomes, reduce urban migration and facilitate rural development.
- Mitigation assessments suggest that by improving and maintaining rural roads, about a 3% CO2 mitigation rate is possible in the transport sector by 2030. For example, emission modeling on rural access road projects by the Asian Development Bank (ADB) indicates that rural roads development and rehabilitation projects were found to have a neutral or slightly reduced effect on CO2 emissions compared with the BAU scenario.
- Rural road improvement projects improve the efficiency of traffic flow and reduce low-speed high carbon intensity travel with a modest induced traffic impact. Furthermore, periodic maintenance projects can have a CO2 emissions reduction impact of 5- 10% or more, as maintenance reduces surface roughness, thus also reducing road user costs, air pollution, and travel time
[/vc_column_text][/vc_tta_section][vc_tta_section i_icon_fontawesome=”fas fa-traffic-light” add_icon=”true” title=”Stricter speeding regulations” tab_id=”1596507415137-c7fc49e2-2929″][vc_column_text]
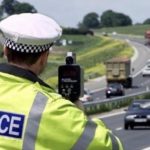 Legislate and enforce stricter speeding regulations by operational and technical means to reduce emissions and road crashes
Introducing lower speed limits on motorways and urban roads can lead to significant reductions in road accident deaths and also reduce fuel consumption, noise pollution, CO2 and air pollutant emissions. The magnitude of reductions depends on a number of factors including vehicle fleet composition, technologies deployed, driving behavior, frequency and magnitude of speeding, congestion, and traffic diversion due to reduced speed.
Characterisation
- Action applies to both passenger and freight vehicles.
- Application is limited to motorized modes, with main focus on private cars, though this action also has potential application to public transport vehicles (e.g. long-distance buses).
- CO2 benefits are likely to be limited as compared to sustainable development benefits, but tangible reductions in carbon emissions can be gained by operating motor vehicles at lower speeds.
- Speeding regulation is introduced to attempt to improve traffic safety. The World Health Organization identifies speed control as one of various interventions likely to contribute to a reduction in road casualties and recommends that governments set and enforce appropriate speed limits, as well as enhance programs of law enforcement with public information and education campaigns (e.g., on the dangers of speeding and the social and legal consequences of doing so). Speed limits may also be set in an attempt to reduce the environmental impact of road traffic (i.e. vehicle noise, vibration, emissions).
Status of deployment
HGVs in the UK have been subject to mandatory 97 km/h speed limiters since the early 1990s, which was subsequently revised to 90 km/h during EU harmonization. Some heavy goods vehicle operators (typically big-name retailers) further reduce their HGV limiters from 90 km/h to a lower speed, typically 85 or 80 km/h, in a claimed bid to reduce fuel consumption and emissions. Globally, all heavy vehicles in developing economies in South America, Latin America and Africa have speed limiters in heavy vehicles.
Estimated Impact
- It has been estimated that tightening highway speed limits from 120 to 110 km/h could deliver fuel savings of 12–18%, assuming 100% compliance with speed limits. However, relaxing these assumptions to a more realistic figure implies a saving of just 2–3%. For trucks, a speed reduction from 90 km/h to 70-80 km/h could yield 3-8% reductions in CO2 emissions, and meaningful reductions can also be achieved by reducing urban speed limits.
[/vc_column_text][/vc_tta_section][vc_tta_section i_icon_fontawesome=”fas fa-subway” add_icon=”true” title=”Modernize rail fleets” tab_id=”1596507543563-64d8be14-0b2f”][vc_column_text]
 Modernize ageing rail fleets and traction systems to increase efficiency
Older train fleets tend to be based on older, less efficient technologies. In today’s context it would be inappropriate to use them for a period of over 30 years, but basic economics often prevents them from being replaced before the end of their natural life spans. However, these systems can be modernized by retrofitting newer technologies, especially newer traction power systems that are more powerful and more efficient; this transition can be accomplished quickly and at a relatively low cost.
Characterisation
- Action has potential to increase rail efficiency for both passenger and freight transport.
- Action is focused specifically on rail, but can have impact co-benefits for other modes through increased reliability/decreased conflicts and potentially reduced air pollution.
- Rail investments have great potential to decrease future transport emissions, due to the relative efficiency of this mode. Rail infrastructure carries 10 times more transport units per km than road, using roughly 11 times less energy per unit. Each dollar invested in rail yields 3 to 10 times less CO2 emissions, while carrying 3.5 times more transport units. The UIC Low Carbon Rail Transport Challenge provides incentives to increase rail efficiency at a global scope.
- Railway modernization can have important safety as well as energy-saving benefits. For example, the construction of grade separations between railways and roads throughout Israel is intended primarily to increase safety. There have been several accidents on level crossings, when road vehicles have become stuck on the railway track.
Status of deployment
A consortium of 18 partners representing major stakeholders across Europe is working together on the EU-funded MERLIN Project to develop a pan-European railway energy management system, with five case studies in four European countries helping evaluate various aspects of improved energy management. The UIC Low Carbon Rail Transport Challenge provides incentives to increase rail efficiency at a global scale.
Estimated Impact
- Over the past two decades, rail freight fuel efficiency improvement was double road freight fuel efficiency improvement. Many developed and developing countries are establishing mode share and energy efficiency improvement targets (i.e. expansion of railway networks along with energy efficiency improvements). While the planning and construction of new rail infrastructure can take several years and is often cost intensive, the addition of energy saving elements to existing infrastructure can be done much more quickly and is thus of great interest for railway companies, rail manufacturers, and operators.
- Modernizing rail fleets and tracking systems could result in 0.3-3% reduction in national transport emissions by 2030. India has targeted a 15% improvement in energy efficiency and a mode share increase from 36% to 45 % by 2020, and has targeted a shift to electricity with 80% of rail freight and 60% of passenger traffic projected to run on electric energy by 2030.The Canadian rail sector has targeted not only reduction in the intensity of greenhouse gas emissions from rail operations but also aims to monitor and reduce criteria air contaminants.Australia has estimated that rail fuel efficiency improvements have the capability to reduce transport CO2 emissions, by increasing the penetration of a range of energy saving technologies such as regenerative braking, fuel cells or heat exchangers.A metro modernization contract by Alstom in Mexico City demonstrated a 35% reduction in energy consumption, increased the expected lifetime of tires by around 15%, and yielded €500,000 of annual savings through electric braking
- The International Railway Association (UIC) has proposed an ambitious transport sector challenge in the framework of the green growth agenda and climate change perspective for 2030 and 2050, i.e. to reduce specific final energy consumption (50% by 2030 and 60% by 2050) and specific average CO2 emissions from train operations (50% by 2030 and 75% by 2050), all relative to a 1990 baseline.[1] As of October 2015, the UIC Low Carbon Rail Transport Challenge had registered projects to increase rail modal shift in Argentina, Bangladesh, China, Colombia, India, and Uzbekistan.
[/vc_column_text][/vc_tta_section][vc_tta_section i_icon_fontawesome=”fas fa-biking” add_icon=”true” title=”Walking & cycling infrastructure” tab_id=”1596507697619-baae3dbe-5259″][vc_column_text]
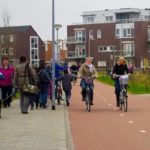 Provide and improve walking and cycling infrastructure (e.g. connected walking paths, protected cycle lanes), reallocating roadspace where necessary
‘Complete streets’ are designed and operated to enable safe access for all users, including pedestrians, bicyclists, motorists, and transit riders of all ages and abilities. A more equitable allocation of roadspace will make it easier to cross the street, walk to shops, and bicycle to work. At the same time, complete streets allow buses to run on time and make it safer for pedestrians to access train stations, while continuing to accommodate motorists.
Characterisation
- Action is primarily focused on passenger transport, but a successful Complete Streets policy must accommodate needs for freight deliveries at appropriate times and locations to maintain a vibrant urban economy.
- Action spans all land based motorized and non-motorized modes, with important emphasis on pedestrian and cycling infrastructure, which often receive less total roadspace than motorized modes.
- 28% of all trips in US metropolitan areas are one mile or less, yet 65% of these trips are now made by automobile, in part because of incomplete streets that make it dangerous or unpleasant to walk, bicycle, or take transit. Complete Streets would help convert many of these short automobile trips to multi-modal travel, and other studies have calculated that 5-10% of urban automobile trips can reasonably be shifted to non-motorized transport.
- Policies to increase the acceptability, appeal, and safety of active urban travel, and discourage travel in private motor vehicles, would provide larger health benefits than would policies that focus solely on lower-emission motor vehicles, as confirmed by separate models that linked transport scenarios in London and Delhi with physical activity, air pollution, and risk of road traffic injury.
Status of deployment
- Complete Streets have been widely implemented in much of Northern Europe, and with some success in other parts of the world. However, in much of the developing world, automobile-focused transport infrastructure is outpacing efforts to balance roadspace for all transport modes; thus, there is great potential to reduce negative impacts through a rapid implementation of complete streets.
- In Portland, Oregon, new transit investments and continued improvements to bicycling and walking infrastructure have thus far resulted in per capita CO2 emissions reductions of 12.5%. Ultimately, Portland’s Complete Streets and associated land use policies yield carbon savings worth between USD $28 and USD $70 million annually.
Estimated Impact
- The Compact of Mayors, the largest coalition focused on helping mayors combat climate change, recently announced that partner cities and towns can deliver half of the global urban potential GHG emissions reductions available by 2020.However, this would require rapid transformation of the transport sector in cities. This is possible by reallocating urban space and investments to walking, cycling, and public transit.
- Evidence suggests that more than USD $100 trillion in cumulative public and private spending could be saved, and 1,700 Mt of annual CO2 —a 40% reduction of urban passenger transport emissions—could be eliminated by 2050 if the world expands urban public transport, walking, and cycling. By increasing public transport, walking, and cycling trips, about 50% of urban vehicle travel could be avoided in 2050, as compared with a baseline scenario. This could result in about 1 to 10% reduction in countries transport sector emissions by 2030.This could also lead to significant health benefits due to reduced cardiovascular and respiratory disease from air pollution and road accident reductions.
- Furthermore, there are significant benefits expected from increased physical activity. Research in London and Delhi has established that reduction in CO2 emissions through an increase in active travel and reduced use of motor vehicles had larger health benefits (7,332 disability-adjusted life-years (DALYs) in London, and 12,516 in Delhi in 1 year) than from the increased use of lower-emission motor vehicles (160 DALYs in London, and 1696 in Delhi). The combination of active travel and lower-emission motor vehicles would give the largest benefits (7,439 DALYs in London, 12,995 in Delhi), notably from a reduction in the number of years of life lost from heart disease.
[/vc_column_text][/vc_tta_section][vc_tta_section i_icon_fontawesome=”fas fa-bolt” add_icon=”true” title=”Expand electric vehicles fleets” tab_id=”1596507818928-448257ad-a1da”][vc_column_text]
Ramp up charging infrastructure to encourage expansion of electric vehicle fleets in primary and secondary cities
The global uptake of electric vehicles (EVs) will depend on a number of factors, including advances in vehicle and battery technologies, reduced costs from economies of scale, enabling policy environments, and government incentives. The widespread availability of charging infrastructure is a necessary condition for a broad global rollout of EVs, which will increase the attractiveness of EVs across market segments, and will allow EV integration into larger urban transport systems (e.g., as last-mile solutions from public transport hubs).
Characterisation
- Action has potential application to both passenger and freight transport, though current charging technologies are more efficient for relatively smaller passenger vehicles.
- Action applies specifically to on-road motorized vehicles, which can include two-, three-, and four-wheelers.
- The IEA suggests that if transport is to contribute to a CO2 target consistent with a 2DC stabilization pathway, technologies such as plug-in hybrid, battery electric vehicle and fuel cell vehicles would have to reach an annual market share of about 30% of global LDV sales in a balanced Avoid/Shift/Improve 2DC scenario by 2030. To achieve maximum CO2 reduction, renewable energy would have to be scaled up in global power generation.
- In its latest estimates, WHO indicates that outdoor air pollution causes 3.7 million premature deaths worldwide per year. People living in LICs and MICs disproportionately experience the burden of outdoor air pollution, with 88% of the 3.7 million premature deaths occurring in these countries. As transport is amongst the major sources of outdoor air pollution, the transition to electric-mobility will contribute towards reducing the associated mortality and economic losses.
Status of deployment
As one of the Action Areas of the UN Climate Summit, the Urban Electric Mobility Initiative (UEMI) aims to boost the share of electric vehicles in annual sales to 30% (2-3 wheelers and LDVs) and to integrate electric mobility into a wider concept of sustainable urban transport, which will achieve a 30% reduction of GHGs in urban areas by 2030.
Estimated Impact
- For global energy-related emissions to peak latest by 2020, the IEA has estimated that the share of petroleum-based transport fuels needs to be decreased from 94% to 87% between 1990 and 2030.IEA has estimated that to reach a 2DS scenario, sales of EVs, which currently constitute less than 1% of car sales worldwide, will need to exceed 40% of total passenger car sales by 2040. This would require the scaling-up of EV infrastructure and implementation of several complementary policies such as the removal of fossil fuel subsidies, and carbon pricing. In the absence of complementary policies, it would be very difficult for countries to reach these targets, i.e. 40% of total passenger car sales by 2040. For example, in Germany, a commitment to achieve an EV share of 20% of new registrations by 2020 appears overly optimistic, based on EV share of less than one percent in 2014.
- If EV penetration is increased, it could provide 0.3-9% mitigation potential in national transport CO2 emissions by 2030. Furthermore, the transport sector can benefit greatly from decarbonizing efforts in the electricity sector. IEA estimates that renewable energy could become the leading source of electricity by 2030 and the carbon intensity of the power sector is projected to improve by 30% during the same period.
- A case study of 18 Japanese cities explored the application of EVs in various contexts, including the deployment of quick charging stations and developing EVs for cold climates, and a 2010 goal to deploy 1,500 vehicles every fiscal year was estimated to reduce CO2 emissions by approximately 2,500 tons yearly. In Colombia, mitigation proposals consider that if 15% EV market penetration and 30% EV market penetration were reached by 2040, this would result in savings of about 10.4 Mt and 19 Mt of CO2 respectively. EV case studies have also been conducted in Singapore, Bangalore, Berlin and London.
[/vc_column_text][/vc_tta_section][vc_tta_section i_icon_fontawesome=”fas fa-gas-pump” add_icon=”true” title=”Tighten fuel economy standards” tab_id=”1596507823259-f72e5fbe-1e05″][vc_column_text]
 Tighten fuel economy standards for passenger vehicles
More fuel efficient vehicles consume less oil and reduce CO2 emissions. Other benefits include air quality improvements and additional resources for other sustainable development priorities.
Characterisation
- Fuel economy improvements can arise in both passenger and freight vehicles, though the latter is likely to be a longer-term process and thus is not included in this action.
- Fuel economy efforts to date have focused on cars and trucks but have the potential to be extended across transport modes, including buses, trains, and aviation/maritime vehicles.
- More fuel-efficient vehicles could consume less oil (54 billion barrels by 2050) and reduce CO2 emissions (33 Gt in total by 2050) globally. Achieving the Global Fuel Economy Initiative (GFEI) target is estimated to account for almost one third of the CO2 reductions necessary to switch individual motorized passenger transport from a 6 degree Celcius (6DS) to a 2DS emission trajectory.
- Fuel economy improvements from conventional internal combustion engine cars can save USD $2 trillion in un-used fuel over the next decade (and up to UDS $8 trillion by 2050), freeing up valuable resources for other development priorities, such as education, health, infrastructure, or the promotion of other transport technologies or modes such as electric vehicles.
Status of deployment
As of early 2016, 27 developing countries are at various stages of developing fuel economy policies with the support of the GFEI. GFEI has built a network of 65 countries to build capacity by sharing good practices, and is broadening its scope to include HDV fuel economy policy development and the promotion of electric vehicles.
Estimated Impact
- The transport sector now accounts for about 23% (7.3 Gt) of annual global energy-related CO2 emissions (32 Gt). This is a significant rise (about 120%) from 3.3 Gt/year during the 1970s, and to achieve a 2DS scenario, CO2 emissions from transport would need to decline to 5.7 Gt annually. However, projections suggest that the global motorized vehicle fleet is set to triple by 2050.
- Simply doubling the fuel economy of the global vehicle fleet would provide significant climate benefits, as it would reduce emissions of CO2 by about 1.5 Gt/year by 2050. It would also result in savings in annual oil import bills of USD $400 million/year in 2050, and a net saving of USD $8 trillion between 2010 and 2050. It would also lead to high co-benefits (i.e. reduced fossil fuel dependence, reduced emissions of short-lived climate pollutants including black carbon, and improved air quality).Considering high growth in the vehicle population, in order to achieve deep reductions in transport sector carbon emissions (i.e. to achieve peak energy related emissions by 2020), progressive fuel economy standards must be implemented so that global average fuel consumption for new LDVs is reduced to around 4 liters per 100 km in 2030, a reduction of 50% relative to 2005. For new freight trucks, standards need to be adopted to achieve a 30% reduction in average vehicle fuel consumption per truck relative to current vehicle fuel efficiency. In order to achieve this, annual average increase in fuel economy (L/100km) must reach 2.7% for LDVs and 2.0% for HDVs.
- In January 2016, the Kingdom of Saudi Arabia implemented new LDV fuel economy standards for all new and used passenger vehicles and light trucks, whether domestic or imported. Kenya has adopted a scheme for imported second-hand vehicles to raise taxes on older vehicles by 150% and lower taxes on newer vehicles by 30%. At national levels, implementing fuel economy standards or improving fuel economy policies could result in a 6% to 22% reduction in transport CO2 emissions by 2030, depending on policies and standards considered and intensity of penetration of fuel efficient vehicles. For example, in the ASEAN region, implementing fuel economy standards for LDVs and HDVs could result in CO2 reductions of 27% by 2035,while similar strategies could yield a 5.7% reduction in Mexico by 2030.
[/vc_column_text][/vc_tta_section][/vc_tta_accordion][/vc_column][/vc_row]